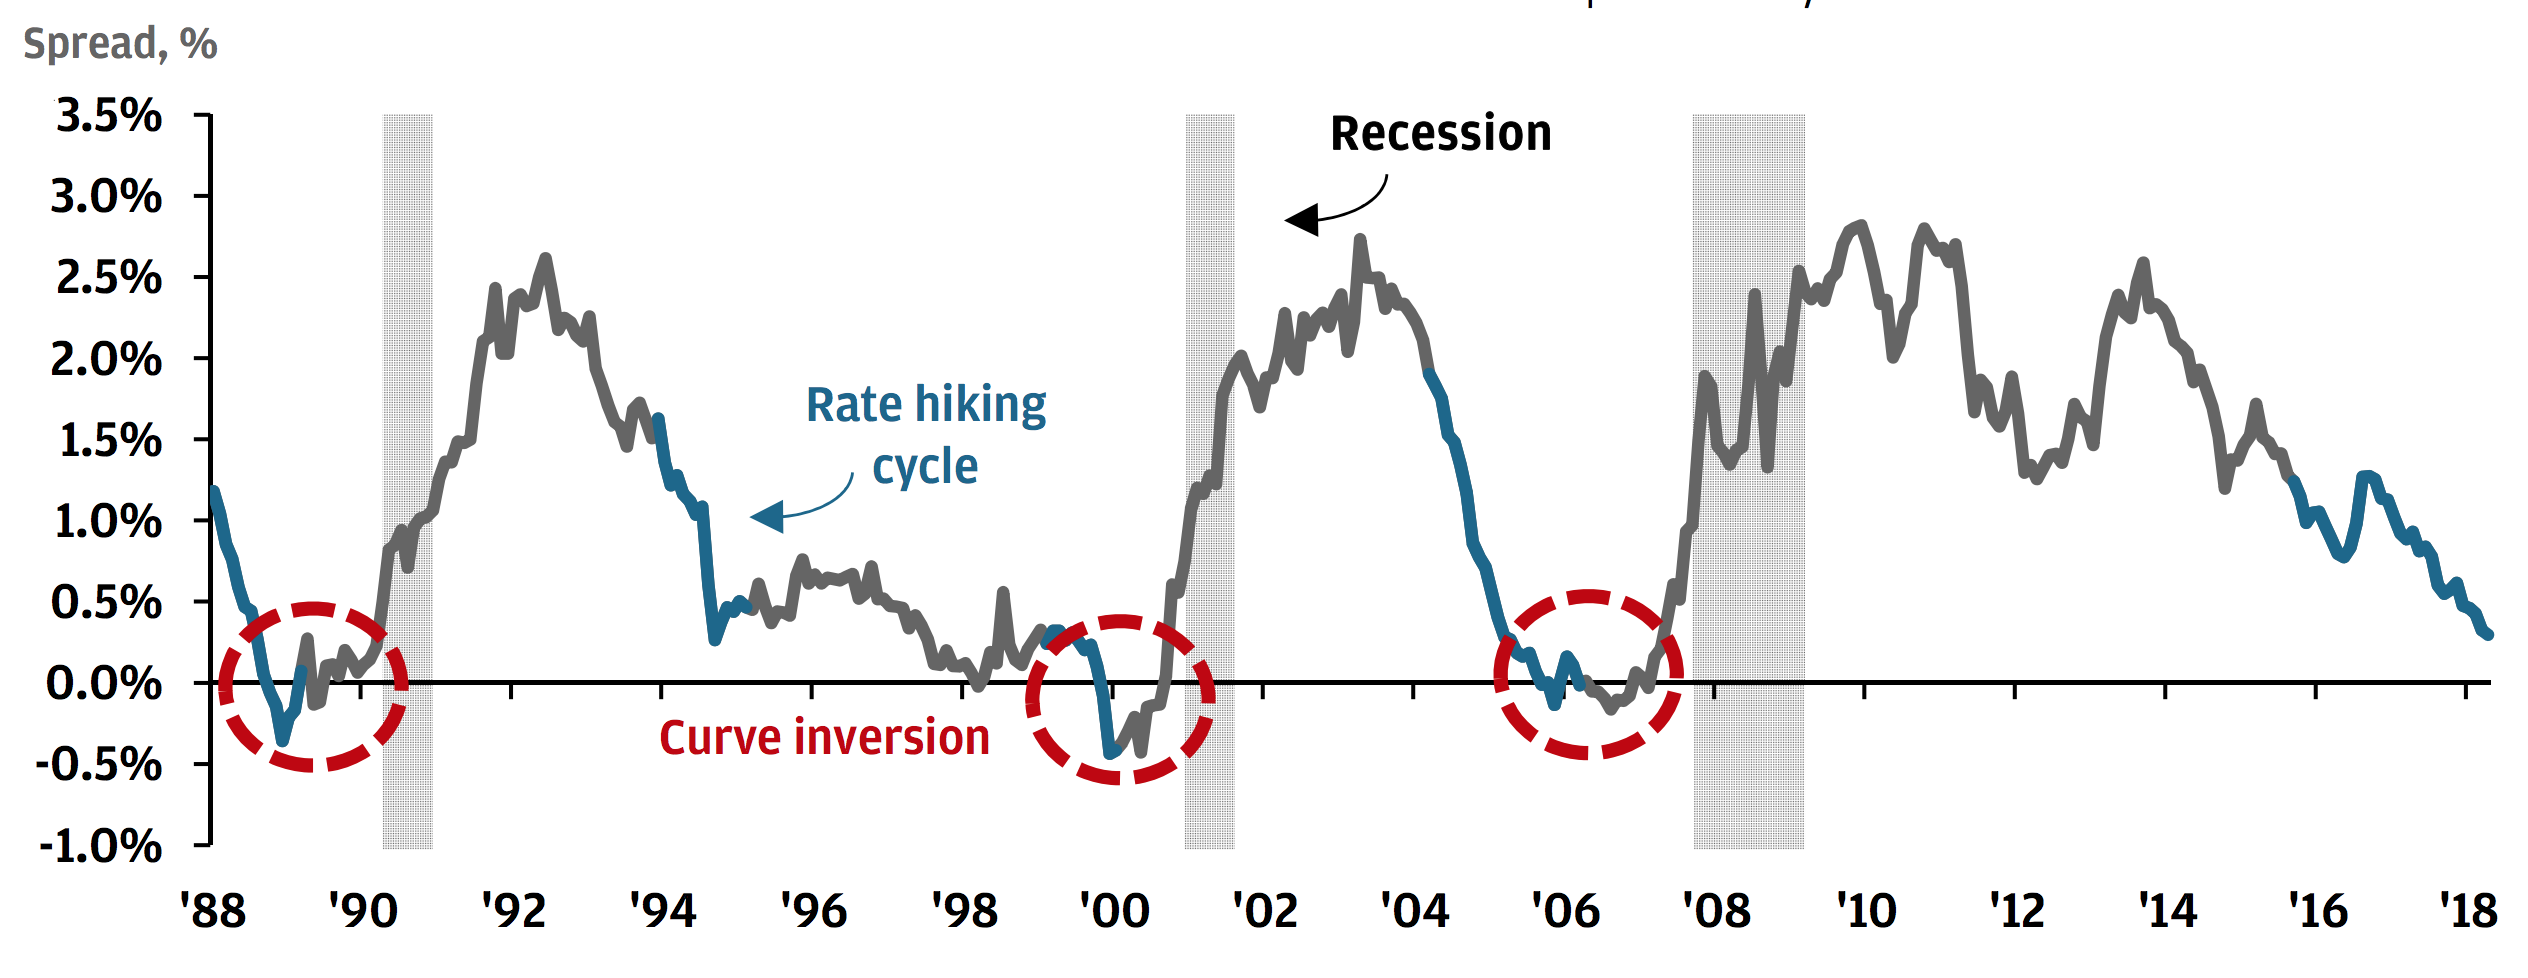
This space has been disseminating a theory of how the shape of the US rate curve is foretelling economic and stock market developments. You might remember that I have observed on two occasions, namely in the era of mid-98 through 2000 and in 2006/07, a particular sequence of 2/10-year curve inversions that started out with a blip of a dip into negative territory, followed by a rebound to normal shape again, only for the curve to ultimately invert and herald fully-blown recessions with subsequent stock market corrections.
I have also argued that as history may not exactly repeat itself but rhyme, we may find ourselves on the eve of not the same but a similar sequence of events and a harbinger of a substantial market correction in the making. A mini-blip into the red did, in fact, occur in late August, and according to the playbook it has been followed by a rebound of the curve into a normal shape again, with the 2- and 10-year rate differential currently sloping positively by around 20bp.
On the advent of the tech bubble and its ensuing recession including the plunge in stock prices it actually took 18 months for the curve to re-invert from its initial blip, whereas ahead of the financial crisis it took a mere 6 months. In the wake of the tech bubble, the stock market correction commenced during the second phase of inversion and lasted 2 1/2 years. Amid the financial crisis, it commenced at the end of the second inversion and lasted less than 2 years.
If we believed for this pattern to repeat itself and noting that the initial blip occurred in late August, 2020 would be the period for another event of subsequent curve inversion, a recession to emerge, and the stock market to gear up for a slump of similar proportions as in 2001/02 and 2008/09 respectively, ie approx. 50% in S&P value. Again, this may never come to bear as halving the S&P today would sink it to a rather unimaginable level of 1,500, but significant a decline is not to be ruled out.
And wouldn’t this scenario perfectly fit into the political landscape also? As a president who is basically running his re-election campaign on the economic record and the stock market, Donald Trump needs the house to hold up until November. He is poised to do everything in his power to elevate the economic sentiment by a trade agreement of sorts with China, no matter what he is saying at the NATO summit, and he will be on the Fed’s case to make sure monetary easing will keep the indices at their lofty heights.
The historical pattern cited and the sequencing of events if they turned out to materialise as such may actually support Trump’s schedule perfectly to get an election win across the finishing line. Whoever will be the next president, and whatever happens going into 2021, it will ultimately matter less in the context of the political cycle if the first part of a presidential term is burdened by a potential recession and a correction in stock prices.
I appreciate no one has been crazy enough to write about such analogies, but wasn’t it the same with the consistent curve flattening that this space has been warning about for the better part of the past two years. Also there, no one wanted to acknowledge the phenomenon until it became too blatantly obvious to ignore it. Maybe the sages in the ivory tower who have gotten this wrong so many times are being a lot more alert these days and have already started with measures to eventually stem the avalanche.
What I am referring to is the Fed’s proactive stance on the repo market since September, whether that mini-crisis was caused by big banks’ portfolio shifts or not, as reported
here. From one day to the next, tapering was history and excess liquidity pumped back into the system. Jay Powell may have tried to divert commentators and analysts alike from thinking that this would be QE, but what else is it supposed to be? The Fed’s balance sheet has since been blown up again by around 300 billion dollars.
This represents 45% of the entire tapering effort since the end of 2017, with probably no end in sight to ensure smooth money markets into year-end. What this Fed action means apart from bringing calm back to the interbank market, however, is that it doesn’t constitute QE in the traditional sense, buying long-end Treasury bonds etc, but it is a tool to control the short end of the curve. So, if the Fed were worried about the pattern and the harbinger of a second curve inversion, it would counter-steer such a development.
In any case, we are far from any normalisation of monetary policy. On the contrary, it seems we are back to the old days of the Fed taking charge of managing the system.
