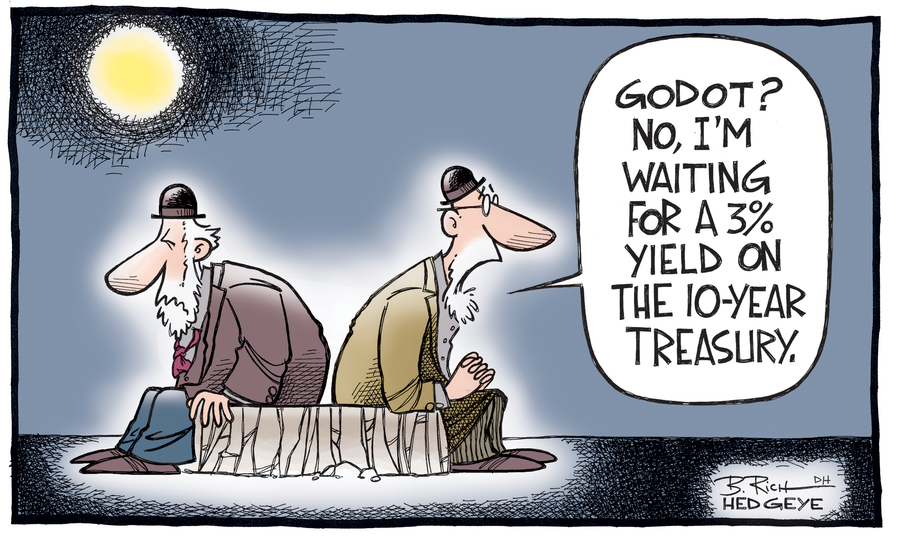
And yet another piece of good news, or so the pundits are exuberantly calling it… Senator Bob Corker’s turn in the tax vote makes it almost certain that the package will be passed. Now the market will be presented with a milestone that it has desired since Trump’s election. Isn’t that great…? Maybe we will see yet another bounce in stock prices on Monday on the back of it. A happy Christmas seems to be assured.
Don’t get too wound up in the pre-Xmas celebrations however. There is every reason, as there always is by the way, to tread most carefully going into the year-end and to sense how we will start 2018. The ones who follow trends and historical market moves can see quite a few red flags out there. Of course there is no holy grail of forecasting, but markets do talk to us, if one only cares to listen.
As this space has been warning for quite a while now, the flattening yield curve is one of those red flags. And no, it is not to be dismissed by simply acknowledging slower inflation expectations that allegedly will be ridden out over the longer term. This flattening we have observed before in this so far short century, in 2001 and 2006, and it has in both cases led to a recessionary environment with a massive follow-on correction in risk markets.
But, will the observant readers throw in, hasn’t it been this space’s contention that the economy can no longer be explained with traditional cyclicality and has become a product of structural change driven by predominantly demographics and technological transformation? You are absolutely right, as structural has replaced cyclical for the past 20 years now. It makes utmost sense to point to 2001 and 2006 in this context.
Fact is that, despite all the jubilations around perceived economic advances and stock market gains, the 2/10 year differential in Treasury yields has hit a new 10 year low at the 51bp handle and is firmly on course for further flattening. I still believe that 2018 will be the year of an entirely flat if not inverted curve, which, make no mistake, is to be seen as the harbinger of a material economic slowdown.
It isn’t just the trend that has remained so intact. It is also the rising momentum in that move. Whatever measure one applies, it is a very similar picture. The 2/30 year move has even accelerated in past couple of months, ending the week at a reading of 85. Compare this to 200bp at the beginning of the year, or to 400bp+ in 2011. It appears nothing can stop that train. Instead, the stubborn Fed speak fuels it.
Or watch every other version to look at curve steepness, such as the 5/30 year differential for that matter, which has halved from 100bp in less than 3 months. Same with a historically very stable 10/30 year curve that is now hovering around the low 30bp area, from a high of 160bp in 2010! Even that one dipped into negative territory in 2006, something that can equally not be ruled out for 2018.
Such number scenario isn’t that far away. If the 2 year part of the curve kept its momentum from the 1.80%-ish level and reached or even overshot the 2% threshold, which is very much achievable against the current backdrop, and the continuously slower than expected inflation numbers put pressure on the long end, ie push 10 years down to 2% again and 30 years through 2.50%, then voila… You are already looking at a flat to inverted curve.
The Fed, ie Jay Powell, will have to make up their minds about what to do with this. Again, Powell not being a trained economist doesn’t mean he is likely to overlook the phenomenon. One wonders what he might really have felt, when he joined in last week’s Xmas chorus of 3 more hikes next year. If the curve tells us something truthful here, then it will be up to him to put the brakes on the current policy sooner rather than later.
My sense is that, amid a persistent flattening in coming months, Powell’s lingo will change as he takes over the reigns at the Fed in February. The first piece of hedge he’s already built in, by being instrumental in returning the Fed to data- from schedule dependency. With this, he retains the option to look at macro numbers and change tack without much ado. There should be considerable doubt that we will see 3 hikes next year.
But isn’t a potentially more dovish outlook in monetary policy good for risk market…? Granted, this notion has definitely worked throughout the past, but there is another gap to be closed. Stocks have massively outperformed high yield bonds, unlike any other year in the past decade. It is to be expected that those performances will re-converge at some point in the not too distant future.
If this space is right however, and a softer economy in the US doesn’t support those rich valuations in domestic high yield bonds any longer, how would the stock market manage to steam ahead and keep breaking every rule in the correlation book? This will be the space to be watched early on in 2018 and throughout. It will be where money is going to be made or lost.
The world’s investable funds better turn their attention to 1. duration trades, the ones that have been shunned by the mainstream due to their misguided views of higher long rates. 2. credit markets that still trade at a yield premium to the US and particularly Europe, and 3. emerging market economies that aren’t necessarily affected by a US slowdown. In any case, let’s watch that rates curve closely.
